Appearance
Insights
Insights looks at the patterns in your logs. Everything is worked out from what you already tracked.
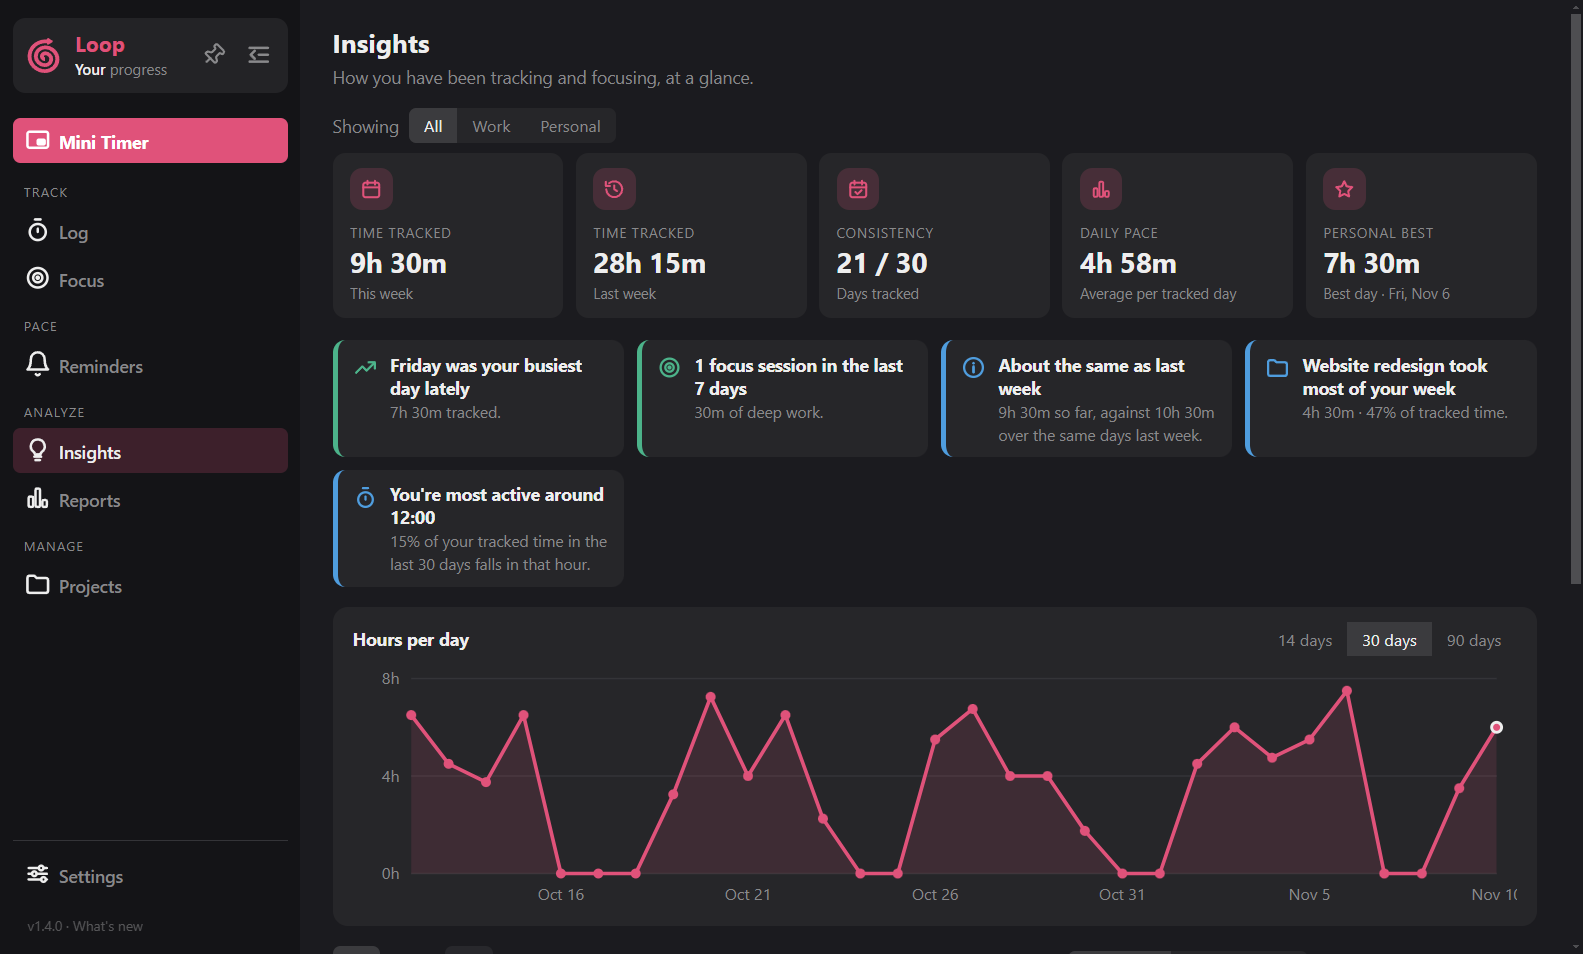
The top
Five tiles: this week, last week, days tracked, average per tracked day and best day. Below them is an hours per day chart (14, 30 or 90 days).
Activity calendar
A grid like GitHub's: one column per week, Monday to Sunday. A filled square means something was logged that day. Click any day to open it on the Log page. The arrows move three months at a time.
Insight cards
Short observations such as forgotten timers over 10 hours, unnamed logs, this week against last, your busiest day, top project, peak hour, late-night share, streaks and focus sessions.
Use the All / Work / Personal switch to change what Insights counts.